
Waist-height index curves of Colombian adults
Abstract
Introduction. Colombia presents a progressive increase in overweight and abdominal obesity in adults, with a higher impact on women.
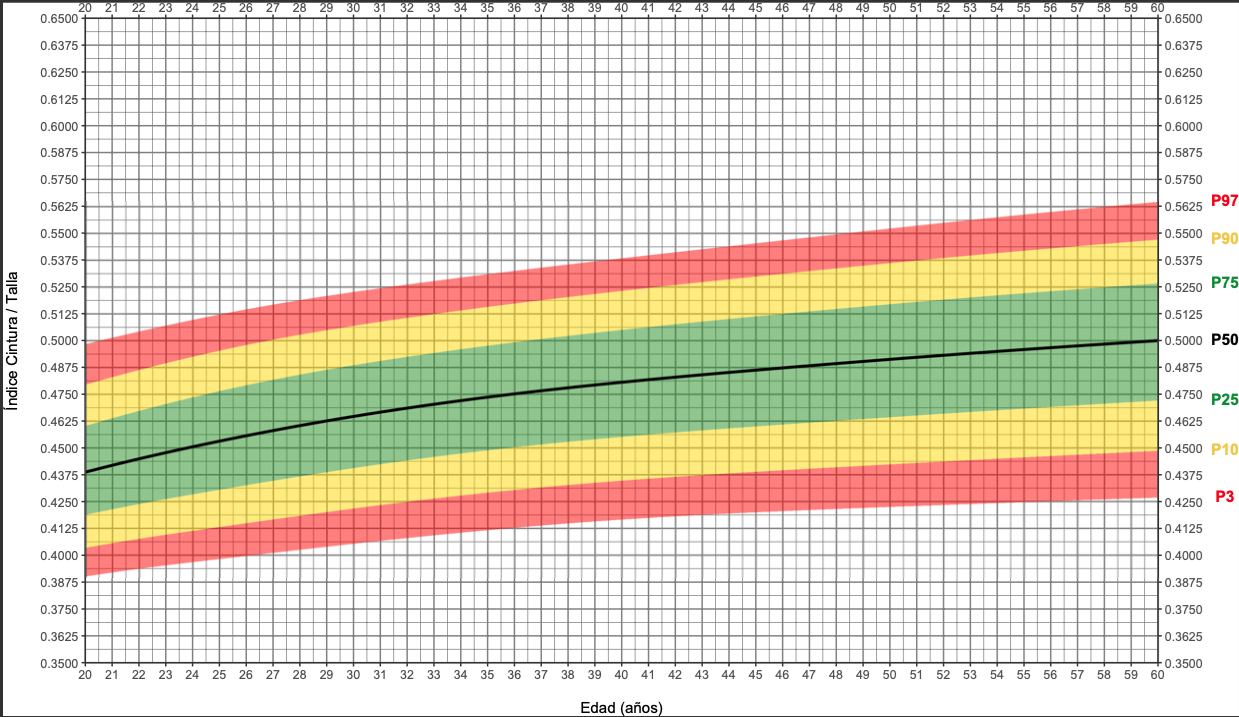
Objective. To design percentile curves of the waist-height index of Colombian adults by sex and age.
Materials and methods. We did a secondary analysis of the data from the Encuesta Nacional de la Situación Nutricional 2015, which contained waist, weight, and height measurements of adults between 20 and 60 years of age. Generalized additive location, scale and shape additive models with box-cox power exponential transformation to construct the curves. An internal validation was performed to ensure the models fit the data.
Results. We studied 23,759 multiethnic adults from Colombia, 49.8% of whom were women. The waist-height index curves of men were visualized with slight curvature, while those of women appeared flatter. The median waist-height index increased continuously in both sexes: up to 45 years in women (0.45 to 0.49) and up to 55 years in men (0.44 to 0.49). In men, a value of 0.50 was maintained after 55 years, but not in women, since it remained at 0.50 until 53 years and thereafter increased to 0.51.
Conclusion. The curves fitted with the box-cox power exponential distribution explained the increasing behavior of the waist-height index by age and sex and the predictive capacity of the model. The total increase in the median of the waist-height index by age and sex was similar and incremental (women: 0.45-0.51; men: 0.44-0.50).
Downloads
References
1. Lobstein T, Jewell J. What is a “high” prevalence of obesity? Two rapid reviews and a proposed set of thresholds for classifying prevalence levels. Obesy Rev. 2022;23:e13363. https://doi.org/10.1111/obr.13363
2. Benjumea MV, Bermúdez J. Situación nutricional por indicadores antropométricos. En: Encuesta Nacional de la Situación Nutricional de Colombia – ENSIN 2015. Bogotá: Instituto Colombiano de Bienestar Familiar/OPS/INS/UNAL; 2016. p. 362-585.
3. Ministerio de Salud y Protección Social. Resolución 2465 de 2016. Fecha de consulta: 8 de marzo de 2024. Disponible en: https://www.minsalud.gov.co/sites/rid/Lists/BibliotecaDigital/RIDE/DE/DIJ/resolucion-2465-2016.pdf
4. Bajpai A. Waist‑to‑height ratio—The new body mass index? Indian J Pediatr. 2022;89:849-50. https://doi.org/10.1007/s12098-022-04257-2
5. Pasdar Y, Moradi S, Moludi J, Saiedi S, Moradinazar M, Hamzeh B, et al. Waist-to-height ratio is a better discriminator of cardiovascular disease than other anthropometric indicators in Kurdish adults. Sci Rep. 2020;10:16228. https://doi.org/10.1038/s41598-020-73224-8
6. Tuomilehto J, Lindstrom J, Eriksson JG, Valle TT, Hamalainen H, Ilanne-Parikka P, et al. Prevention of type 2 diabetes mellitus by changes in lifestyle among subjects with impaired glucose tolerance. N Engl J Med. 2001;344:1343-50. https://doi.org/10.1056/NEJM200105033441801
7. Siren R, Eriksson JG, Vanhanen H. Waist circumference a good indicator of future risk for type 2 diabetes and cardiovascular disease. BMC Public Health. 2012;12:631. https://doi.org/0.1186/1471-2458-12-631
8. Ministerio de la Protección Social, PROFAMILIA, Instituto Nacional de Salud, Instituto Colombiano de Bienestar familiar. Encuesta Nacional de la Situación Nutricional en Colombia – ENSIN 2010. Bogotá: Da Vinci Editores y Cía.; 2011.
9. Wang Y, Beydoun MA, Min J, Xue H, Kaminsky LA, Cheskin LJ, et al. Has the prevalence of overweight, obesity and central obesity levelled off in the United States? Trends, patterns, disparities, and future projections for the obesity epidemic. Int J Epidemiol. 2020;49:810-23. https://doi.org/10.1093/ije/dyz273
10. Ramírez-López LX, Aguilera AM, Rubio CM, Aguilar-Mateus AM. Síndrome metabólico: una revisión de criterios internacionales. Rev Colomb Cardiol. 2021;28:60-6. https://doi.org/10.24875/RCCAR.M21000010
11. Lear SA, James PT, Ko GT, Kumanyika S. Appropriateness of waist circumference and waist-to-hip ratio cutoffs for different ethnic groups. Eur J Cli Nutr. 2010;64:42-61. https://doi.org/10.1038/ejcn.2009.70
12. Tang HK, Nguyen CTC, Vo NHT. Anthropometric indicators to estimate percentage of body fat: A comparison using cross-sectional data of children and adolescents in Ho Chi Minh City, Vietnam. Indian J Pediatr. 2022;89:857-64. https://doi.org/10.1007/s12098-021-03882-7
13. Zhang S, Fu X, Zhi Du, Guo X, Li Z, Sun G, et al. Is waist‑to‑height ratio the best predictive indicator of cardiovascular disease incidence in hypertensive adults? A cohort study. BMC Cardiovasc Disord. 2022;22:214. https://doi.org/10.1186/s12872-022-02646-1
14. Hernández-Rodríguez J, Duchi-Jimbo PN, Domínguez-Alonso E, Díaz-Díaz O, Martínez-Montenegro I, Bosch-Pérez Y, et al. Valor de corte del índice cintura/talla como predictor independiente de disglucemias. Rev Cubana Endocrinol. 2017;28.
15. Meseri R, Ucku R, Unal B. Waist:height ratio: A superior index in estimating cardiovascular risks in Turkish adults. Public Health Nutr. 2014;17:2246-52. https://doi.org/10.1017/S136898001300267X
16. Peng Y, Li W, Wang Y, Bo J, Chen H. The cut-off point and boundary values of waist-toheight ratio as an indicator for cardiovascular risk factors in Chinese adults from the PURE study. PLoS ONE. 2015;10:e0144539. https://doi.org/10.1371/journal.pone.0144539
17. Gonçalves M, Fonseca-Passos MC, Daleprane J, Correa-Koury J. Is it possible to identify underlying cardiovascular risk in young trained military? J Sports Med Phys Fitness. 2016;56:125-32.
18. Kahn HS, Bullard K. Beyond body mass index: Advantages of abdominal measurements for recognizing cardiometabolic disorders. Am J Med. 2016;129:74-81.e2. https://doi.org/10.1016/j.amjmed.2015.08.010
19. Staynor JMD, Smith MK, Donnelly CJ, Sallam AE, Ackland TR. DXA reference values and anthropometric screening for visceral obesity in Western Australian adults. Sci Rep. 2020;10:18731. https://doi.org/10.1038/s41598-020-73631-x
20. Forero AY, Forero LC. Comparación entre mediciones e índices antropométricos para evaluar la obesidad general y la abdominal, Colombia ENSIN 2015. Biomédica. 2023;43(Supl.3):88-98. https://doi.org/10.7705/biomedica.7011
21. Vargas-Moranth R, Alcocer-Olaciregui A, Bilbao-Ramírez J, Lío-Carrillo JF, Fontalvo-De Alba G, Cerro-Martínez C, et al. Prevalencia de obesidad según relación cintura-talla en cuatro municipios del caribe colombiano. Archivos de Medicina. 2018;18:60-8. https://doi.org/10.30554/archmed.18.1.2356.2018
22. Instituto Colombiano de Bienestar Familiar, Ministerio de Salud y Protección Social, Instituto Nacional de Salud. Encuesta Nacional de la Situación Nutricional – ENSIN 2015. Bogotá: Instituto Colombiano de Bienestar Familiar/OPS/INS/UNAL; 2016. p. 37-88.
23. Lohman TG, Roche AF, Martorell R. Anthropometric standardization reference manual. Champaing: Human Kinetic Boocks; 1988. p. 177.
24. The International Society for the Advancement of Kinanthropometry – ISAK. Protocolo internacional para la valoración antropométrica. 2019. Fecha de consulta: 8 de marzo de 2024. Disponible en: https://www.youtube.com/watch?v=Ff2WDc7LhXU
25. Cleveland WS, Grosse E, Shyu WM. Local regression models. In: Chambers JM, Hastie TJ, editors. Statistical Models. New York: Wadsworth & Brooks/Cole; 1992.
26. Koenker RP, Pin Ng, Portnoy S. Quantile Smoothing Splines. Biometrika. 1994;81:673-80. https://doi.org/10.2307/2337070
27. Stasinopoulos DM, Rigby RA. Generalized additive models for location scale and shape (GAMLSS) in R. J Stat Softw. 2007;23:1-46. https://doi.org/10.18637/jss.v023.i07
28. Rigby RA, Stasinopoulos DM, Voudouris V. Discussion: A comparison of GAMLSS with quantile regression. Stat Model. 2013;13:335-48. https://doi.org/10.1177/1471082X13494316
29. Royston P, Altman DG. Regression using fractional polynomials of continuous covariates: Parsimonious parametric modelling (with discussion). Appl Statist. 1994;43:429-67.
30. Durrleman S, Simon R. Flexible regression models with cubic splines. Stat Med. 1989;8:551-61. https://doi.org/10.1002/sim.4780080504
31. Rigby RA, Stasinopoulos DM, Heller GZ, De Bastiani F. Maximum likelihood estimation. In: Distributions for modeling location, scale, and shape: Using GAMLSS in R. 1st ed. Boca Ratón (FL): Chapman and Hall/CRC; 2019. p. 143-73.
32. WHO Multicentre Growth Reference Study Group. Assessment of differences in linear growth among populations in the WHO Multicentre Growth Reference Study. Acta Paediatr. 2006;95:56-65. https://doi.org/10.1111/j.1651-2227.2006.tb02376.x
33. Cohen J. Statistical Power Analysis for the Behavioral Sciences. 2nd ed. Hillsdale (NJ): Lawrence Erlbaum Associates. 1988. Fecha de consulta: 8 de marzo de 2024. Disponible en: http://www.utstat.toronto.edu/~brunner/oldclass/378f16/readings/CohenPower.pdf
34. Bozdogan H. Akaike’s information criterion and recent developments in information complexity. J Math Psychol. 2000;44:62-91. https://doi.org/10.1006/JMPS.1999.1277
35. Mardia KV. Applications of some measures of multivariate skewness and kurtosis in testing normality and robustness studies. Sankhyā B. 1974;36:115-28.
36. Royston P, Wright EM. Goodness of fit statistics for the age-specific reference intervals. Stat Med. 2000;19:2943-62. https://doi.org/10.1002/1097-0258(20001115)19:21<2943::aid-sim559>3.0.co;2-5
37. van Buuren S, Fredriks M. Worm plot: Simple diagnostic device for modelling growth reference curves. Stat Med. 2001;20:1259-77. https://doi.org/10.1002/sim.746
38. Rigby RA, Stasinopoulos DM. Smooth centile curves for skew and kurtotic data modelled using the box-cox power exponential distribution. Stat Med. 2004b;23:3053-76. https://doi.org/10.1002/sim.1861
39. Byrd RH, Lu P, Nocedal J, Zhu C. A limited memory algorithm for bound constrained optimization. SIAM J Sci Comput. 1995;16:1190-208.
40. Rigby RA, Stasinopoulos DM. Automatic smoothing parameter selection in GAMLSS with an application to centile estimation. Stat Methods Med Res. 2014;23:318-32. https://doi.org/10.1177/0962280212473302
41. Millar SR, Perry IJ, Phillips CM. Assessing cardiometabolic risk in middle‑aged adults using body mass index and waist–height ratio: Are two indices better than one? A cross‑sectional study. Diabetol Metab Syndr. 2015;7:73. https://doi.org/10.1186/s13098-015-0069-5
42. Fu-Liang Zhang, Jia-Xin Ren, Peng Zhang, Hang Jin, Yang Qu, Yao Yu, et al. Strong association of waist circumference (WC), body mass index (BMI), waist-to-height ratio (WHtR), and waist-to-hip ratio (WHR) with diabetes: A population-based cross-sectional study in Jilin province, China. J Diabetes Res. 2021:8812431. https://doi.org/10.1155/2021/8812431
Some similar items:
- Ana Yibby Forero Torres, Luis Carlos Forero, Comparison between anthropometric measurements and indices to evaluate general and abdominal obesity, Colombia ENSIN 2015 , Biomedica: Vol. 43 No. Sp. 3 (2023): Enfermedades crónicas no transmisibles
- Oscar F. Herrán, Gonzalo A. Patiño, Sara E. Del Castillo, Dietary transition and excess weight in adults according to the Encuesta de la Situación Nutricional en Colombia, 2010 , Biomedica: Vol. 36 No. 1 (2016)
- Beatriz Caicedo-Velásquez, María Clara Restrepo-Méndez, The role of individual, household, and area of residence factors on self-rated health in Colombian adults: A multilevel study , Biomedica: Vol. 40 No. 2 (2020)
- Harvy Mauricio Velasco, Lina Patricia Buelvas, Characterization of patients with skeletal genetic diseases in a Colombian referral center , Biomedica: Vol. 37 No. 2 (2017)
- Elizabeth Borrero, Gabriel Carrasquilla, Neal Alexander, Decentralization and health system reform: What is their impact on malaria incidence in Colombian municipalities? , Biomedica: Vol. 32 (2012): Suplemento 1, Malaria
- María Victoria Benjumea, Alejandro Estrada, Carmen Lucía Curcio, Estimation equations for the height of Colombian elders using knee height , Biomedica: Vol. 39 No. 4 (2019)
- Rosa Magdalena Uscátegui, Adriana María Correa, Nutritional status of children with malaria in northwest Colombia , Biomedica: Vol. 27 No. 4 (2007)
- Elpidia Poveda, Diana Giraldo, Yibby Forero, Carlos Mendivil, Self-reported physical activity in comparison with anthropometric body fat indicators in school children , Biomedica: Vol. 28 No. 3 (2008)
- Sandra Lorena Girón, Julio César Mateus, Fabián Méndez, Impact of an open waste disposal site on the occurrence of respiratory symptoms and on health care costs of children , Biomedica: Vol. 29 No. 3 (2009)
- Patricia Escobar, Katherine Paola Luna, Indira Paola Hernández, César Mauricio Rueda, María Magdalena Zorro, Simon L. Croft, In vitro susceptibility of Trypanosoma cruzi strains from Santander, Colombia, to hexadecylphosphocholine (miltefosine), nifurtimox and benznidazole , Biomedica: Vol. 29 No. 3 (2009)
Copyright (c) 2025 Biomedica

This work is licensed under a Creative Commons Attribution 4.0 International License.
| Article metrics | |
|---|---|
| Abstract views | |
| Galley vies | |
| PDF Views | |
| HTML views | |
| Other views | |